Dollar-Oil Correlation -Is it a Fluke?
Dollar-Oil correlation is one of the most mesmerizing correlation that I have come to learn as a forex trader.
I dub this dollar-oil correlation a Kabuki dance correlation, sort of an activity or drama carried out in real life in a predictable or stylized fashion, reminiscent of the Kabuki style of Japanese stage play.
The reason being, I seem to know that the correlation exists between the two. But the correlation that this pair exhibits is a real dynamic one, ever changing with global economic cycles.
Before we probe deeper into this dollar-oil correlation, let's have a better understanding about crude oil classifications, crude oil benchmark blends, and spot prices versus future prices.
Crude Oil Classifications
Scientific community base crude oil classifications depending on it's density and sulfur content. However for our discussion, I'll stick with generally accepted practice talk about "light" or "heavy" and "sweet" or "sour" oil.
Light Vs. Heavy Crude Oil
Light crude has lower density compared to heavy crude oil. Lower density makes light crude easier to refine and transport than heavy crude oil. Gasoline and diesel fuel are the desired finished product obtained from light crude.
Sweet Vs. Sour Crude
Sweet crude has lower sulfur content than sour crude. Lower sulfur in sweet crude results into lower refinery costs as compared to sour crude.
Crude Oil Benchmark Blends
Now we're familiar with crude oil classification, let's discuss crude oil benchmark blends.
Crude oil is priced in terms of regional blends, each with different characteristics. Traders follow certain blends that reflect the overall value of oil. From about 161 different types of crude oil traded all over the world, the four primary benchmarks are noteworthy to mention.
Brent Blend
This blend refers to a light, sweet crude from 15 different oil fields in the North Sea. When UK and other European media reports on crude oil price they refer to a barrel of Brent blend crude oil sold at London's International Petroleum Exchange (IPE).
West Texas Intermediate (WTI)
This benchmark refers to the U.S. based light and sweet crude oil traded in New York Mercantile Exchange (NYMEX). Throughout our discussion on dollar-oil correlation, I will refer to this WTI index for oil and USDX for dollar index.
Dubai
This benchmark refers to Dubai based light but sour crude oil.
OPEC basket
This benchmark refers to the OPEC -an organization of countries that produce oil -crude basket made up of 13 different regional oils viz: Algeria's Saharan Blend, Angola's Girassol Ecuador's Oriente, Indonesia's Minas, Iran's Iran Heavy, Iraq's Basra Light, Kuwait's Kuwait Export, Libya's Es Sider, Nigeria's Bonny Light, Qatar's Qatar Marine, Saudi Arabia's Arab Light, the United Arab Emirates' Murban, and Venezuela's BCF 17.
Spot Prices Versus Future Prices
Spot Price refers to the price paid for oil now -as in the amount of money you would hand over to a cashier at Chevron store for their tossing a barrel of oil into your truck.
Future Price refers to the price paid for oil contracts promising the delivery of oil at a future date.
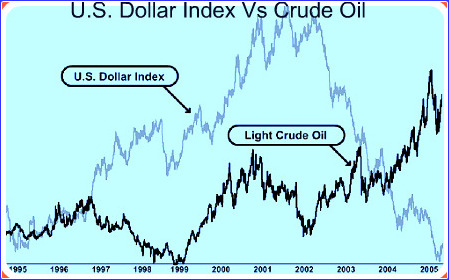
 Figure 1. U.S. Dollar Index (USDX) Vs. Crude Oil (WTI)
Figure 1. is a ten year dollar-oil correlation chart where this correlation swings back and forth to positive and negative territory.
From 1995 to 1997 a strong positive dollar-oil correlation, a move where both dollar and oil index move same direction in tandem, is in effect.
Next two years from 1997 to 1999 marks strong negative correlation, a move where both dollar and oil index move in opposite direction.
Again from 1999 to 2001 these pairs exhibit strong positive correlation as both of them make move to north in tandem.
Around 2001 this strong positive dollar-oil correlation breaks down to a strong negative correlation.
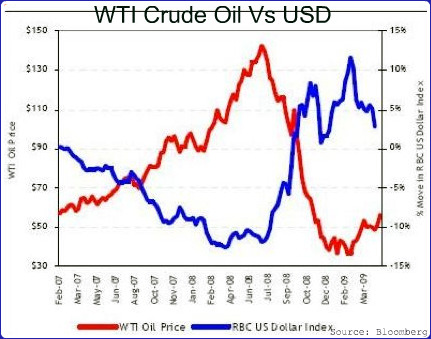
 Figure 2. WTI Crude Oil Vs. USD
Figure 2. is the most recent year correlation graph.
As pronounced in the graph, the strong negative correlation between these pairs is well worked out all throughout the years 2007, 2008 and 2009.
Now you might be saying -so I see this 2 year positive correlation followed by 2 year negative correlation then followed by current state of negative correlation between dollar and oil, how can I profit from this information?
What significant conclusions can I draw from these dollar-oil correlation graphs that I can implement in my trading practices?
Allow me to chant my thought processes here...
Oil is one of the most global viable commodity pegged to the U.S. dollar -the US dollar is the currency of choice in global crude oil trade.
As with any other commodities pegged in terms of the U.S. dollar, oil price tend to climb higher with weaker dollar.
Weaker dollar makes oil cheaper from non-U.S. buyer's perspective. So from investors perspective, it will be wise to buy a viable commodity like oil when it's cheaper. This could have a net effect of driving high demand causing price inflation for oil.
So high gasoline price translates to a weaker dollar and vice versa.
Hence forex trader can use dollar-oil correlation as a radar to forecast dollar moves.
Makes perfect sense -as long as you have a PhD in economics.
For those who don't, I piled facts high and run deeper analysis to extract meaningful conclusion whether dollar-oil correlation is simply a fluke or simply an outcome of the broader economic effects coupled with a stronger or weaker U.S. dollar?
Let's analyze strong negative dollar-oil correlation first.
Dollar gets devalued when the U.S. economy is weak.
The primary reasons for weak U.S economy can be credited to: huge trade deficits, massive Iraq war costs, credit crunch crisis of 2007 -an economic condition in which loans and investment capital are difficult to obtain, followed by sub prime lending crisis - crisis which involved financial institutions in the U.S. lending in ways which do not meet "prime" standards to an extent which puts the loans into the riskiest category of consumer loans and are typically sold in a separate market from prime loans.
As the economy weakens, the Fed cuts interest rate.
The Fed funds rate before September 2007 was at 5.25%. Since the beginning of credit crunch crisis of 2007, the Fed cut rate several times to the current rate which stands at 0-.25% as of December 2009.
Lower interest rate translates to lower rate of return so the investment dollar leaves an ailing U.S. economy as fleas leave a dead body for better return abroad.
Lower dollar translates to cheaper oil for non-U.S. buyers.
Say oil is $100 per barrel and 70 Euros buy $100. Then 70 Euros buy a barrel of oil as it is pegged to dollar. When dollar gets devalued currency like Euros appreciate.
For EUR/USD pair say Euros appreciate by 10 percent. Then it means now you can buy same $100 with only 63 Euros.
In other words, now it will cost only 63 Euros to buy a barrel of oil.
Will this drive high demands for oil -Yes or No?
The best answer is maybe or maybe not.
I reside in San Francisco, California, U.S.A.
The dollar devaluation implies I can buy less oil with the same dollar at local Chevron retail store.
So it seems like the demand for oil will be less if you reside within the U.S. territory, because nobody likes to pay higher oil prices. But people in the rest of the world can now afford more oil with the same or less amount due to dollar devaluation.
Can they drive high demand for oil? Generally speaking the answer is Yes.
They will hoard oil causing high demand for oil.
Another factor that comes in play is that investors use oil as a hedging tool. Commodity traders trading oil hedge their position by setting long on oil futures - if the perceived notion is higher oil prices in future then short the U.S. dollar.
The combined net effect is high demand for oil which translates to high oil prices that I will likely pay to fill up my car and a weaker dollar.
So can you connect the dots how weak dollar correlates to high oil prices?
And can you make safer bet in your forex trading career with these information?
Next let's point our finger to positive correlation.
In order to understand positive correlation I will highlight demand growth forces namely the U.S. dot com boom.
During the period of 1990-2000 stock markets in the U.S. saw their equity value rise rapidly from growth in the more recent internet sector and related fields.
Led by lower interest rate, the stock market, specifically in the U.S, climbed higher in an unprecedented manner.
Companies were seeing their stock prices shoot up if they simply added an "e-" prefix to their name and/or a ".com" to the end, which an anonymous author dubbed "prefix investing"
Generally speaking, demand for oil, as well as energy is closely tied to global economic cycles.
When economy is booming new factories are added and jobs are created. Such new factories consume energy, shipping companies transport more goods, and people take more trips both in terms of business and vacation time.
The demand for oil thus increases pushing oil prices high. Since the economy is booming -or even the news of heating economy brings more investment dollars into the country which leads to higher dollar too.
This is it! My thoughts processes find a logical connection for higher oil price correlate to higher dollar value during time of economic boom.
Should the U.S. economy gets on track for another economic boom probably equity growth in bio-tech industry, I wouldn't be surprise to see the current strong negative correlation between dollar and oil breakdown and change to a strong positive correlation.
So now can you explain why dollar-oil correlation can become a tell-tell sign for economic changes without PhD in economics?
-
Return to
- Dollar-Oil Correlation
- Currency Correlation
- Home


Have your say about what you just read! Leave me a comment in the box below.