Learn Ascending Triangle ...Simple and Elegant Continuation Pattern
The ascending triangle is a bullish continuation pattern. It is a variation of the symmetrical triangle.
It differs from the symmetrical triangle in forecasting implication that the symmetrical triangle is inherently neutral. In studying the symmetrical triangle the analyst can assume that the previous trend (either uptrend or downtrend) will continue.
It's formation signals that a market is entering a consolidation phase until it gathers enough steam and shoots off the roof.
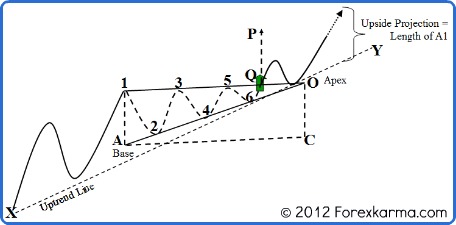
 A Bullish Ascending Triangle
In the figure above, the upper trendline represented by a line that passes through points 1-3-5 is flat. The lower trendline represented by a line that passes through points 2-4-6 is ascending. These two lines converge at a point O called an apex.
A base represented by a vertical line that passes through points 1-A measures the height of the triangle.
REQUIREMENTS
The following requirements must be met in order to classify a pattern formation as the ascending triangle pattern formation.
- The existence of a prior trend is a must. Since the ascending triangle is a bullish continuation pattern, it occurs in an uptrend.
- It requires four reversal points in mimimum to form the ascending triangle. In the above figure, reversal points 1, 2, 3 and 4 are the bare minimum requirement. This is because at least two points are required to draw a line. So four reversal points are required to draw two converging trendlines A-O and 1-O.
- The two converging trend lines must be each touched at least twice. In the above figure, the upper trendline is touched at points 1, 3, and 5. The lower ascending trendline is touched at points 2, 4, and 6.
- Two trend lines represented by the line that passes through 1-3-5 and 2-4-6 must converge at an apex O to form the triangle pattern.
TIME CONSTRAINT
As the pattern formation progresses forward towards the apex, the time is running out for price to emerge out from its cocoon of consolidation. Prices must shoot off in the uptrend direction.
If prices continue to remain in consolidation for a long time and beyond apex then the pattern loses its significance.
An upside penetration of the upper trendline represented by line 1-3-5 is essential for the completion of the pattern formation.
The geometric shapes of the triangle furnishes significant price and time information creating a strategic advantage to a skilled technical analyst.
The two converging trendlines represented by the line that passes through 1-3-5 and 2-4-6 provides boundary for price. In order for pattern formation completion, price must shoot off in the uptrend direction prior to reaching an apex at point O.
Usually the breakout in the uptrend direction should occur somwehere between two-thirds to three-quarters of the horizontal width of the triangle represented by line AC.
SIGNIFICANCE OF VOLUME
As the triangle formation progressess, prices consolidate in a narrow bandwith formed between the lower trendline and the upper trendline. Hence, during this period volume gradually diminishes.
As the price break out in the uptrend direction, the volume bar must rise significantly. This is specially true in the case of uptrend. A lot more effort from bulls are required to penetrate upper trendline and shoot the price to the roof.
Usually the price return near to the apex, just to get another support and then shoot off. The return move should occur on lighter volume.
However, the volume should again rise as the price climbs higher.
MEASUREMENT
For the ascending triangle, upside projection potential can be carried out in the following way.
First measure the height of the line A1 and and project that height as the upside potential from the point of breakout.
In the figure above, the point Q is where the breakout occurred. So line QP is projection of the line A1.
-
Return to
- Ascending Triangle
- Candlestick Analysis
- Home


Have your say about what you just read! Leave me a comment in the box below.