
Candlestick Chart - A Blueprint For Forex Trading Success
Candlestick chart is one of the most indispensable tools of market forecasting in the hands of a skilled technical analysts.
Different types of charts are available to the technicians at their disposal, such as bar charts, line charts, point and figure charts, and candlestick charts. They all record these four vital price information: the open, the close, the high and the low.
Japanese candlesticks charts are by far the most popular in recent years among western chartists. It is considered as the sign language of the financial market. It is thought to have beeen develoved by the Japanese rice trader Munehisa Homma around 18th century. It was introduced among Western chartists by Steve Nison.
The Japanese candlestick charts offer a very visually appealing and easy to recognize price pattern formation than any other forms of charts available. Candlesticks are so named as they look somewhat like a candle.
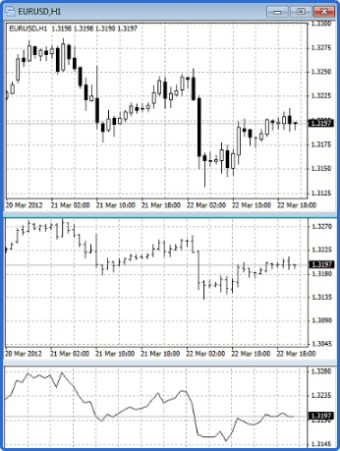 A side bye side comaprison of the candlestick, bar and line chart
The above figure shows the same data plotted in the candlestick format, bar chart and the line chart format.
Needless to mention that information not easily available on the bar chart or line chart jumps off on the candlestick chart. Besides providing visually superior information on the chart, candlesticks also provide wealth of proven pattern combinations that become indespensable at the hand of skilled chartists.
HOW TO READ CANDLESTICKS?
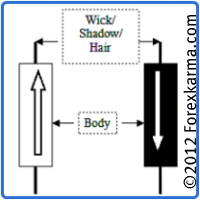
On a candlestick chart, the rectangular shape is called the body. The body represents the difference between the open and the close price on a chart on a given time frame. Generally the body can be either black or white.
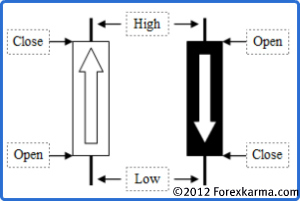
The body of a candlestick is white if the close price was higher than the open price.
The body of a candlestick is black if the close price was lower than the open price.
The small lines above and below the body called as wicks or hairs or shadows represent the high and low prices on a chart on a given time frame.
Relatively speaking though that the black and white color of the body has little signifance other than distinguishing them from each other. The white body could be as well blue or green and considered bullish.
The black body could be red (or the color of your choice) and considered bearish.
But for consistency we will refer to the balck (bearish or short) and the white (bullish or long) body of the candle throught out this article. Moreover, candlestick chart can be produced on a wide range of time frame.
On a daily chart, a candlestick represents price action for the signle day. On a one hour time frame, a candlestick represents price action for an hour. Similarly a candlestick chart can be formed for any time frame representing price action for that give time frame.
BASIC CANDLESTICKS
Based upon the relationship of open, high, low and close prices, candlesticks' body and shadow vary in shape and sizes in a great deal way.
The three basic candlesticks are decisive or the bullish and bearish candles, spinning tops and the doji candlesticks.
The Decision Candles
The Decisive candles are recognized by its full body and smaller wicks or hairs or shadows. White (bullish or long) candle body is formed when the close price is higher than the open. Black (bearish or short) candle body is formed when the close price is lower than the open.
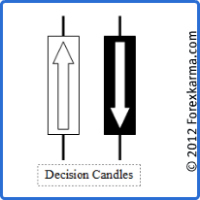 The Decision Candlesticks
The Spinning Tops
The Spinning tops are indecisive candlesticks. They are recognized by their smaller bodies with lower and upper shadows longer than that of the body.
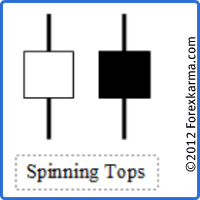 The Spinning Tops Candlesticks
The Doji
The Doji candlesticks are formed when the open price and the close price are equal. They are recognized by their long wicks or shadows or hairs.
There are three different types of Doji candles: the Long-Legged Doji, the Gravestone Doji, and the Dragonfly Doji.
The Long-Leged Doji is recognized by its long upper and lower wick.
The Gravestone Doji is recognized by its long upper wick and no lower wick.
The Dragonfly Doji is the opposite of the Gravestone Doji and is recognized by its long lower wick and there is no upper wick.
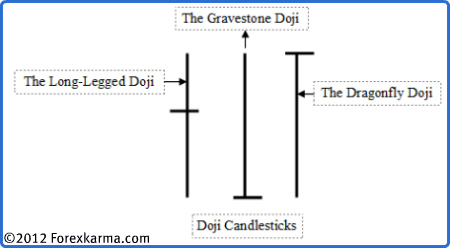 The Doji Candlesticks
-
Return to
- Candlestick Chart
- Technical Analysis
- Home


Have your say about what you just read! Leave me a comment in the box below.