Double Top Pattern - Simple and Elegant Candlestick Reversal Pattern
A double top is a bearish reversal candlestick pattern. It is easier to spot and also appears frequently.
It is also a slight variation of head and shoulders pattern and triple top pattern. The only main difference is that it only has two peaks while other two bears three peaks.
DOUBLE TOP PATTERN FORMATION
Consider an uptrend with each successive higher highs and higher lows.
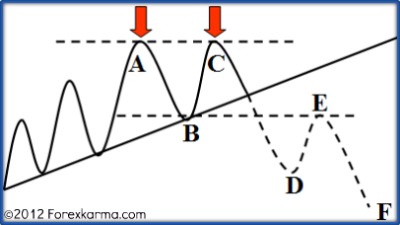
 Double Top Pattern
In the above figure, the market sets the highest point at A on increased volume. The price then dips to point B which is expected as a reaction.
Consider the swing B-C-D.
The market attempts to set new high point as expected for the uptrend to be maintained. However, the market stalls at point C at about the same resistance level as the previous peak.
Also the volume has declined raising a yellow flag of caution.
Next consider the swing C-D-E.
The price then dips and violates the uptrend. When the price falls below the support line represented by the dotted line B-E, then the formation of double top pattern is complete.
Volume generally increases as the price fall below the support level.
Finally consider the swing D-E-F.
The bulls make one final attempt to drag prices to set new high but the selling pressure at around the previous support turned now resistance level at point E is just too great.
By this time bears are in full control and drags the price lower. Thus the downtrend commences henceforth.
SIGNIFICANCE OF VOLUME
Volume plays a significant role in carving this elegant double top pattern. Volume reflects direct buying and selling interestes between bulls and bears.
In general, volume should increase in the direction of the trend.
Reflecting on the role played by volume in carving the double top pattern above, volume should increase on the breaking of the support line along the swing C-D.
Next it should decline on the return move along swing D-E. Then finally, it should again expand along swing E-F.
-
Return to
- Double Top
- Candlestick Analysis
- Home


Have your say about what you just read! Leave me a comment in the box below.