Learn Pennant Pattern ...Simple and Elegant Continuation Pattern
The pennant pattern is formed quite frequently. It is considered as one of the most reliable continuation pattern.
It is so named as the pattern resembles a pennant shape.
This continuation pattern formation illustrates brief pauses in a price breakout only to gather enough steam to continue it's advance in the previous trend direction.
ILLUSTRATION
To illustrate a bullish pennant pattern formation consider an uptrend scenario.
 A Bullish Pennant Pattern
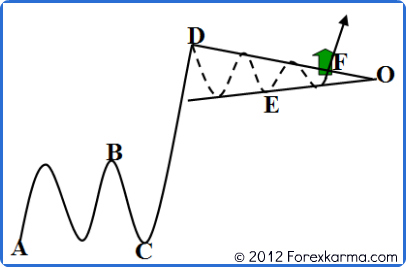
In the figure above, swing A-B-C represents brief pause or consolidation after an uptrend move.
Next, swing B-C-D represents steep price advance.
Finally, swing D-E-F represents another pause before it breakouts penetrating the upper trendline represented by line D-F and resumes it's previous uptrend direction.
Two upper and lower trendlines converge at a point O known as apex forming a small symmetrical triangle.
REQUIREMENTS
The following requirements must be met in order to classify a pattern formation as the bullish pennant pattern.
- The pennant pattern formation must be preceded by a sharp spike in an almost straight line move. In the figure CD represents a sharp spike in price.
- Followed by sharp spike, the pattern then should form consolidation pattern resembling a small symmetrical triangle.
- The consolidation pattern formation should occur in light volume whereas the price breakout should occur in heavy volume.
TIME CONSTRAINT
Typically the pennant pattern should be completed within two weeks range and no longer than three weeks time frame.
As the pattern formation progresses forward, the time is running out for price to emerge out from its cocoon of consolidation. Prices must shoot off in the uptrend direction in the case of bullish pennant pattern.
If prices continue to remain in consolidation for a longer period and beyond apex O, then the pattern loses its significance.
An upside penetration of the upper trendline represented by line D-F is essential for the completion of this continuation pattern.
SIGNIFICANCE OF VOLUME
The volume is low and often diminishes while in consolidation phase.
In the figure above, swings A-B-C and D-E-F represent consolidation phase. During this phase volume is light.
At price breakout volume rises sharply and heavily.
MEASUREMENT
For the bullish pennant pattern, upside projection potential can be carried out in the following way.
 A Bullish Pennant Measurement Method
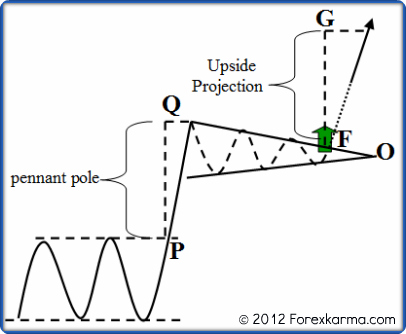
First measure the height of the pennant pole from the first price breakout point.
In the figure above, the first price breakout occured at P so PQ is the height of the pennant pole.
Next, project that pennant pole height as the upside potential from the next point of breakout.
In the figure above, the second price breakout occured at point F. So height FG is the upside projection of the pennant pole height PQ.
-
Return to
- Pennant Pattern
- Candlestick Analysis
- Home


Have your say about what you just read! Leave me a comment in the box below.