
Learn Trend Lines ... Simple Yet Powerful Technical Analysis Tool
Trend Lines are simple yet very effective technical analysis tool. But before introducing trendlines, lets familiarize ourselves with few key terminologies.
TREND DEFINITION
A trend in a financial market signifies the general direction of the market.
 Trend Direction
Unlike a straight line that represents direction in our real life, market directions are characterized by a series of zigzags.
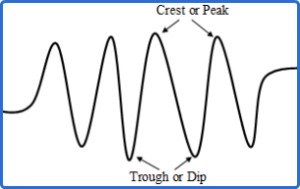 Peak and Trough Of a Wave
These zigzags can be compared to a series of successive waves with distinct peaks and troughs. So when we speak of the market trend, we are speaking of the direction of those distinct peaks and troughs.
THREE DIRECTIONS OF TREND
Trend directions are categorized as: uptrend, downtrend, and sideways trend.
UPTREND
A series of successively higher peaks and troughs illustrate an uptrend.
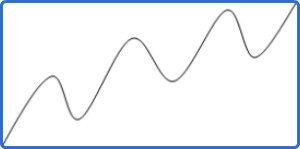 Uptrend
DOWNTREND
A series of successivley declining peaks and troughs illustrate a downtrend.
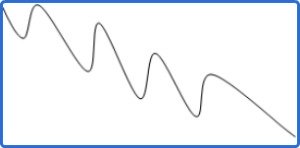 Downtrend
SIDEWAYS TREND
If the trend is neither up or down then its sideways trend. A series of horizontal peaks and troughs illustrate sideways trend.
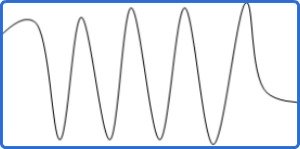 Sideways Trend
THREE CLASSIFICATIONS OF TREND
The trend is classified into three categories namely: the major, intermediate (secondary) and the near term (short term) trend.
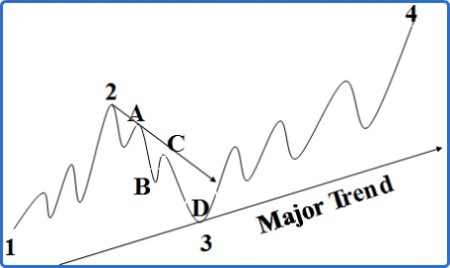 Three Classifications of Trend
In the above figure, swing 1-2-3-4 represents the major trend. Swing 1-2-3 represents the intermediate trend. And swing A-B-C-D within swing 1-2-3 represent the short term or the near term trend.
According to the Dow Theory the major trend lasts longer than a year. The intermediate or secondary trend lasts anywhere between three weeks to few months. And finally, the near term trend lasts less than three weeks. Depending on the financial market sector, the time length for each category of trend may vary.
For example, in the case of foreign exchange, any trend longer than six months could as well be considered as the major trend as forex traders operate in a shorter time dimension. On the other hand, in the case of stock market, any trend longer than a year is considered as the major trend.
Quite a bit of ambiguity arises among traders as a result of time length variation to classify three different trends. So depending on the financial market sector, its all upto an individual trader to decide for themselves to determine time length for the mjaor, intermediate and the near term trend.
Understand though that the Dow Theory identified the three classification of trend primarily for timing purpose. The major trend is used to identify the overall market trend. The intermediate trend identifies the trading direction and the near term trend can be used to initiate market entry.
Market trend comes in series. That being said, each trend becomes a portion of its next larger trend.
For example, an intermediate trend could be a correction in a major trend. And the intermediate correction could itself consists of series of peaks and troughs. These series of peaks and troughs on the intermediate trend could be identified as the near term trend.
TRENDLINES
Trend lines are lines that are drawn along either peaks (rally, highs) or troughs (dips, lows).
Trend lines are simple yet very effective technical analysis tool. Learning to draw correct trendlines pays off in many ways. It is pretty simple on smooth market price movements.
The only prerequisite to drawing any trendlines is the presense of a trend. Once the trend - an uptrend or downtrend, is in effect we can draw trendlines.
To draw an up trendline, there must be two reaction lows with the second reaction low higher than the first one as shown in the figure below. So up trendlines are drawn straight to the right along successive reactions lows.
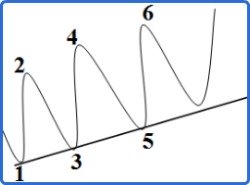 Figure A. Up Trendline
In the above figure, points 1, 3, and 5 are reaction low points. Also reaction low at point 3 is higher than the reaction low at point 1. And reaction low at point 5 is higher than the reaction low at point 3.
To draw a down trendline, there must be two reaction highs with the second reaction high lower than the first one as shown in the figure below. So down trendlines are drawn downward to the right along successive rally peaks or highs.
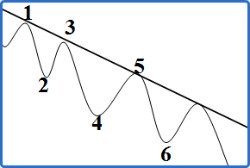 Figure B. Down Trendline
In the above figure, points 1, 3, and 5 are reaction high points. Also reaction high at point 3 is lower than the reaction high at point 1. And reaction high at point 5 is lower than the reaction high at point 3.
So far, all the trendlines that we have drawn are tentative trendlines. A tentative trend line becomes a valid trend line when it is touced a third time with prices bouncing off of it.
In the figure A, a tentative up trendline was drawn when two reaction lows at point 1 and 3 were formed. And the successful test of the up trendline at point 5 confirmed the validity of this trendline.
Figure B shows a down trendline, but the same rule applies.
In summary, two points (either two reaction lows in the case of an uptrend or two reaction highs in the case of a downtrend) are needed to draw a tentative trendline. If and only if the price tests the tentative trend line at the third point and bounces off of it then and only then the trend line is confirmed to be a valid trendline.
APPLICATION OF A TRENDLINE
One of the basic foundation of technical analysis is that prices move in trends.
The corollary to this premise states a trend in motion is more likely to continue until it reverses.
So as long as the trend is intact, trendlines could be used as a buying and selling areas.
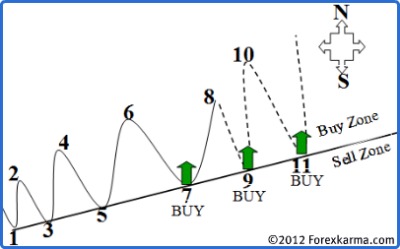 Buy and Sell Zone in an Uptrend
In the above figure, north side of a trendline marks a buy zone and the south side marks the sell zone.
In an uptrend, the trend line acts as a support. So whenever the price dips to point 7, 9, 11 a buy position can be initiated.
In a downtrend, the trend line acts as a resistance. So whenever the price rallies to point 7, 9, 11 a short position can be initiated.
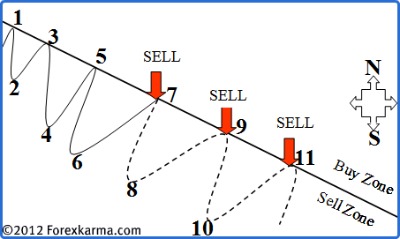 Buy and Sell Zone in a Downtrend
However when trend lines are violated, they send an early sign of change in the existing trend.
In summary, a trend is a friend until it bends. But when the trend lines bend, it is time to liquidate all positions initiated in the direction of previous trend.
IMPORTANCE OF A TRENDLINE
Three factors determine the importance of a trendline:
- the lenght of time it has been intact,
- the number of time it has been tested and
- the steepness or slope of the trendline.
The trendline that has been in effect for three months is more significant than one that has been in effect for three weeks or three days.
Also, the trendline that has been successfully tested for ten times is more significant than the one that has been tested only five times.
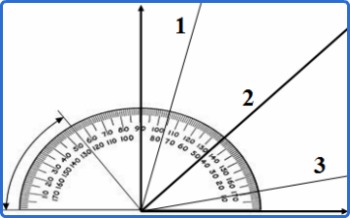
As the trend progresses, the trendline too progresses with certain steepness or slope. This steepness or slope of the trendline help identify if the trend is either significant or unstable.
 Trendline Slope
In the above figure, when the trendline 2 advances in approximate of 45 degree line, such trendline is more significant. This is because at such a rate price and time are in near perfect balance. Thus such trendline is relatively stable.
When the trendline 1 advances too steep, it indicates that the price are moving foward too quickly. Such rapid rate of ascent is unstable in the long run hence steep trendline bears less significance thus less confidence too.
Similarly when the trendline 3 is nearly flat, it indicates that the trend is too weak.
VALID BREAKING OF A TRENDLINE AND ITS ROLE REVERSAL
Technicians exercise variety of time and price filter in order to identify valid trendline penetration and avoid bad signals or "whipsaws". Depending on the type of financail market, some use 1% while others use 3% penetration critera. This means that the trendline be broken on a closing basis by at least 1% or 3%.
In stock market, generally the two day rule is the most commonly applied in determining the valid penetration of a trendline. It requires that price penetrate the valid trendline and close beyond the trendline for two successive days.
In forex trading, I apply a valid breaking of a trendline to require a close of a full bodied candle beyond the trendline. So in the case of an uptrend, a full valid penetration of a trendline requires a full bodied bearish candlestick formation beyond the trendline on the south side or sell zone.
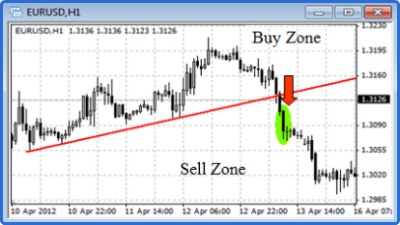 Uptrendline Penetration
Likewise, in the case of downtrend, a valid penetration of a trendline rquires a full bodied bullish candlestick formation beyond the trendline on the north side or buy zone.
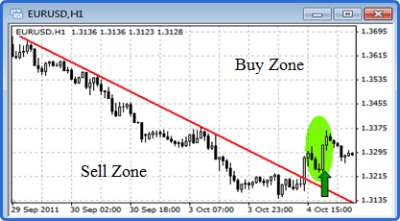 Downtrendline Penetration
Often times, a valid penetration of trendline signal only the change of a more steep trendline to a more sustained trendline. But when major trendline is violated trends change direction and so does the role of trendlines.
In an uptrend, uptrendline acts as a support line. When this uptrendline is violated, it acts as a resistance.
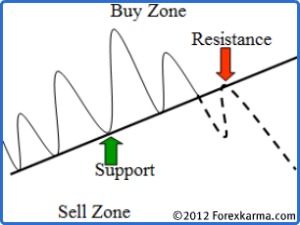 Uptrendline Becomes Resistance When Violated
Similarly in a down trend, downtrendline acts as a resistance line. When this downtredline is violated, it acts as a support.
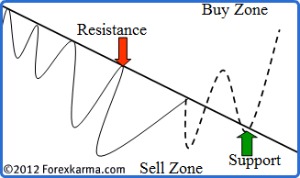 Downtrendline Becomes Support When Violated
-
Return to
- Trend Lines
- Technical Analysis
- Home


Have your say about what you just read! Leave me a comment in the box below.